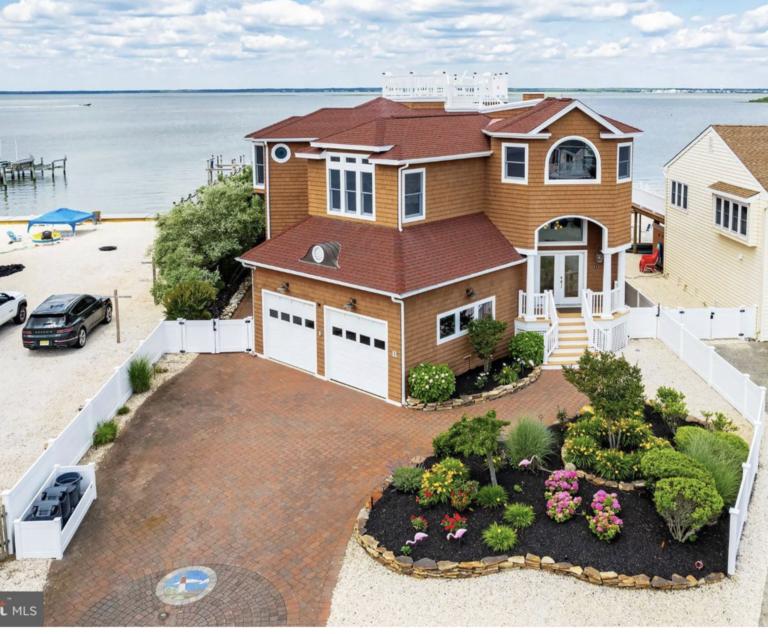
May Market Recap
A Slow Spring ConcludesA Slow Spring Concludes
May closed the books on the spring selling season, and the demand side finished quiet. Just 32 homes went under contract during the month — flat with April but down nearly 16% from the 38 logged a year earlier, and among the lowest May totals on record for the island. It was a fitting end to one of the slowest spring runs LBI has seen in years: contract activity stayed soft from January straight through May, even as listings came to market at their usual pace.
Stacked against the past decade, this May's contract count sits at the very bottom of the range — tied with 2023 for the fewest homes placed under contract in the month of May, and a clear step down from the busier springs that preceded it.
LBI Homes Under Contract — Month of May
10-Year Comparison · Excludes Land Sales
The pattern is consistent with what we tracked all spring: inventory was available, but much of the new supply coming to market wasn't necessarily the inventory buyers were most eager to pursue. Buyers had options across the island, yet many of the listings entering the market required either pricing adjustments or offered less compelling locations, conditions, or features than what today's buyers were seeking.
At the same time, the inventory that checked the right boxes continued to move. Well-located, well-presented, and realistically priced homes often attracted immediate attention and, in many cases, sold quickly. The slowdown wasn't driven by a lack of demand for desirable properties — it was driven by buyers becoming increasingly selective about what they were willing to pay for.
With May finishing among the slowest on record for contract activity, the spring season ultimately became a tale of two markets: desirable inventory continued to find buyers, while a growing share of the available inventory struggled to gain traction.
Priced Too High: Where Buyers Pushed Back
So why did buyers stay patient with so much to choose from? Price. Inventory was never thin this spring — buyers had real options across the island. But a growing share of that inventory was simply priced too high, and the clearest evidence is in where contracts fell off. Break the spring's under-contract activity down by price band, and the pullback is concentrated almost entirely at $3M and under — the brackets that make up the bulk of LBI inventory, and exactly where asking prices had gotten most stretched.
| Price Bracket | 2025 | 2026 | Change |
|---|---|---|---|
| Under $1M | 27 | 13 | −51.9% |
| $1M – $2M | 67 | 56 | −16.4% |
| $2M – $3M | 50 | 37 | −26.0% |
| $3M – $4M | 17 | 18 | +5.9% |
| Over $4M | 12 | 18 | +50.0% |
| Total | 173 | 142 | −17.9% |
The drop-off below $3M is stark. The sub-$1M segment was cut nearly in half, the $2–3M range fell about a quarter, and the broad $1–2M band slid double digits — a combined 26% decline across everything under $3M. These are the brackets where sellers pushed asking prices hardest, and where buyers pushed back just as hard. Above $3M the story flips: the $3–4M range held and the $4M+ tier actually grew, where scarcity and unique high-end product kept motivated buyers engaged. The lesson of the spring is a plain one — the homes priced right moved, and the homes priced too high sat.
Closings, Pricing & Days on Market
May recorded 45 closings at a median sale price of $1,975,000 and an average of $2,230,000 — squarely in line with LBI's premium market position. The close-to-list ratio firmed to 98.0%, up from the spring's high-90s and a notch above March, confirming that sellers are not cutting to the bone to get deals done. Even with demand soft, the homes that sold did so close to ask.
Speed of sale tells the rest of the story. The median days on market for May closings was just 21, even as the average sat at 46 — a wide gap that signals a two-speed market. Well-priced homes are moving fast. Properties that need a correction are sitting, pulling the average up while the median reflects the reality for motivated, realistic sellers.
Cash vs. Financed by Price Range
Through the first five months of 2026, 141 homes have closed island-wide — an almost perfectly even split, with cash purchases narrowly ahead at 71 to 70. The breakdown by price band is where the story sharpens. Financing leads across the broad middle of the market, but at the top, cash takes over — $4M+ buyers closed 8 in cash to just 3 financed. The higher up the market you go, the more deals get done without a lender.
What's Sitting & What It Means
The current active inventory shows exactly where patience is required. The average asking price across active listings is $3,005,000 at an average of $1,210 per square foot — a meaningfully higher price point than what is actually closing, which has been running near $2.23M and roughly $1,055 per square foot. Active listings are averaging 99 days on market (median 64), a gap that reflects both the aspirational pricing common at the top of the range and the simple reality that higher-priced homes take longer to find their buyer.
Of the 120 homes currently active, roughly two-thirds are priced at $2M and above — the inventory is deepest exactly where buyers have been most cautious. That is the central tension heading into summer: plenty of upper-tier selection on the market, and a buyer pool that is being deliberate about what it will pay for it.
Our
Favorite
Properties
Every month we spotlight the LBI listings we're most excited about — best value, strongest rental potential, or simply the most to offer.
Watch This Month's PicksJune Outlook

Buyer Market Outlook
June changes the dynamics of the spring market. The island fills up, homes get harder to access, and the pace shifts. For buyers, that often reads as a poor time to shop — but the summer market tends to be more workable than it looks.
Getting into homes takes more planning now. By June, much of the active inventory is occupied — summer renters are in, owners are using their places, and the easy same-day showings of April are gone. You may wait a few days for a window between turnovers to get inside a property.
That access friction has a flip side. Fewer buyers are willing to work around it, which means fewer people are getting into each listing and less competition for the homes that are available. A buyer who is organized — pre-approved, clear on what they want, and willing to plan showings around occupied homes — generally faces less bidding pressure in summer than in the spring or the upcoming fall rush, and a better chance of securing a given home rather than competing against multiple offers.
There is also still real selection. 120 homes are active right now, with roughly two-thirds priced at $2M and above — so the depth of inventory sits in the mid-to-upper part of the market.
The takeaway: summer's access hurdles thin out the buyer pool, which can work in favor of anyone willing to navigate them. For buyers who are pre-approved and clear on what they want, June is often a quieter, less competitive window than it appears. We are glad to help coordinate showings around occupied homes and review what is currently available.
Seller Market Outlook
One shift worth understanding heading into summer: the season has become considerably more active than it used to be. For years, spring and fall were the clear leaders for contract activity, and summer ran a step behind — the season for using the house, not buying one. That gap has largely closed. On a five-year average, summer is now comparable to spring.
Much of that demand fits what we would describe as the "new LBI buyer." It has become increasingly common to see someone visit the island for the first time — often in peak summer — and decide they want to own here, and a growing share of that demand is new wealth discovering LBI. The clearest evidence is at the top of the market: $4M+ contracts have multiplied roughly five-fold since 2019. Much of that growth is new construction, and notably the market is absorbing it — these are not homes sitting unsold. There is real demand for high-end product, with buyers meeting the new supply at close to the pace it is built.

It is worth connecting this to the buyer side. As we noted there, you may not see as many active buyers methodically touring in summer — access is harder, and the most deliberate, pre-planned shoppers thin out. But summer is, hands down, the season for spontaneous buyers: people who came to the island to vacation rather than to shop, and decide on the spot that they want to own here. That kind of buyer is rarely in the market at any other point in the year.
June itself is consistently one of the busier contract months of the year. Looking at the five-year average for each month, it ranks among the busiest on the calendar — well above the overall monthly average and ahead of the entire late-spring stretch that leads into it:
Average LBI Contracts by Month
5-Year Average · 2021–2025 · Excludes Land Sales
It also helps explain why summer open houses tend to draw well. There are simply more people on the island, and more of them are first-timers who did not arrive planning to buy. Cloudy and rainy days are often the strongest of all — when the beach is off the table, more of that foot traffic ends up at an open house.
None of this changes the one constant: pricing remains the deciding factor. Well-priced homes are going under contract quickly, often within the first week or two, while listings sitting past 90 days are generally the ones that came in above the market. Summer brings the traffic; accurate pricing is what converts it into an offer.
The practical takeaway for sellers: summer now draws a buyer pool comparable to the spring market, and a meaningful share of it is new to the island. For anyone weighing a sale in 2026, the summer months are a legitimate selling window rather than an off-season. We are glad to review what a home is worth in today's market and what a realistic timeline looks like.
New Listings
Fresh on the Market - the island's newest listings.
Search Properties
Explore curated listings sorted from highest to lowest price.
Highest to Lowest
Lowest to Highest
By Neighborhood

Introducing our Investment Analysis!
Provided to all of our clients, our analysis delivers projected year-over-year ROI, long-term investment projections, rental income estimates, closing costs, and more - all dynamically tailored to your situation.
The Guarino Team
The Island's Fastest-Growing Real Estate Team

We're not just here to open doors — we're here to make sure you walk through the right one.
We don't just know the Long Beach Island market. We live it, invest in it, and study it every single day.
From accurate pricing guidance and rental ROI projections to strategic offer structures that win in competitive situations, we help buyers approach the market with clarity and confidence.
With deep local roots, modern valuation technology, and a relentless work ethic, we're redefining what a real estate advisor should be.
Ready to Begin Your LBI Journey?
It's never too early to reach out. The more time we have to understand what you're looking for, the better positioned you'll be when the right property comes along.