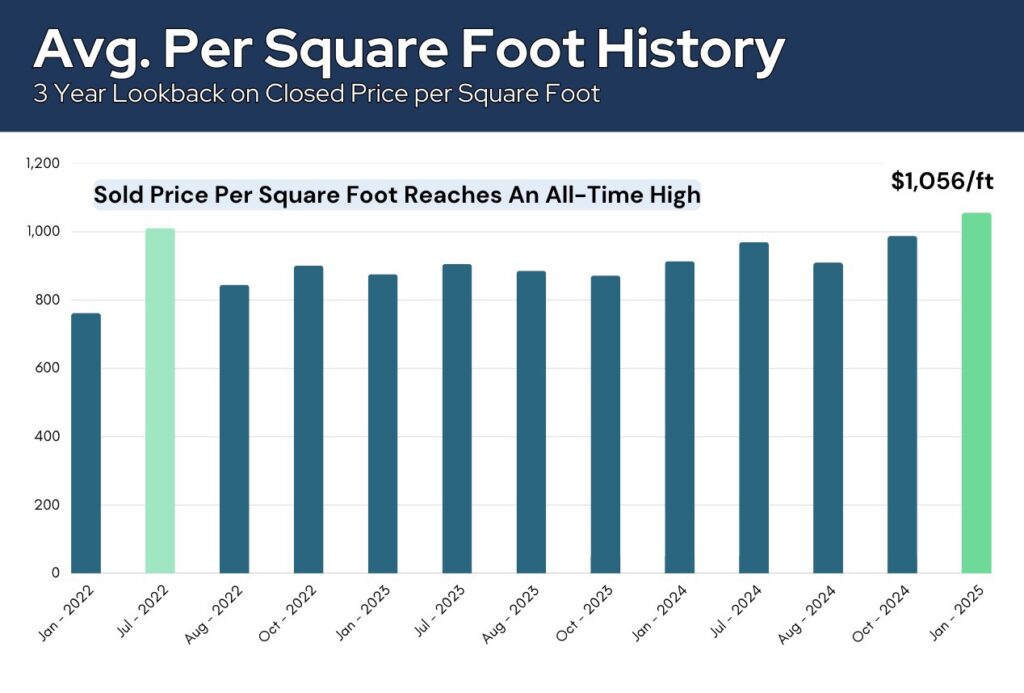
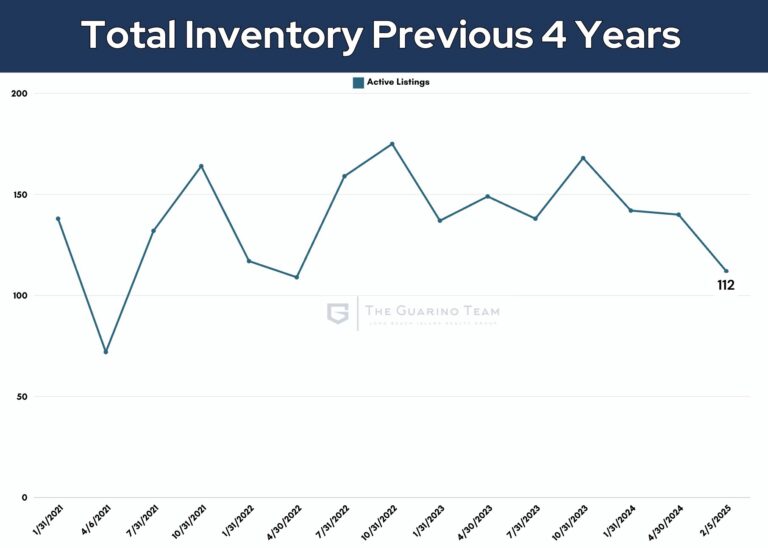
A notable surge in buying activity that began post-election in late November has continued into the new year. January saw 30 properties placed under contract, reflecting a 47% increase over the same month last year. This strong sales performance, paired with a steady flow of new listings and a higher-than-usual number of expired listings, has led to a notable dip in inventory. Total listings dropped from 134 to 114, reaching a new three-year low. As of the date of this post, just 112 listings remain on the market—nearly 40% lower than the 183 listings available in mid-October. The increase in buying activity, combined with six waterfront sales and several new construction properties, resulted in the average sale-to-list price reaching a historic high of $1,056 per square foot.
February Outlook
The spring market typically gains momentum in late February, with more buyers and sellers returning to the market. However, with inventory currently at a near three-year low, it’s crucial to watch whether enough new listings come to market in the next 4-6 weeks to meet growing demand. Without sufficient new inventory, we could face a continuation of historically low stock as the peak of the spring market approaches. Buyers should remain proactive, especially on desirable new properties, while considering negotiations on properties that have been on the market longer. Sellers, on the other hand, should keep an eye on market conditions and time their listings carefully—aiming for a low-inventory window, but when the majority of buyers are actively searching in the spring market.


")


