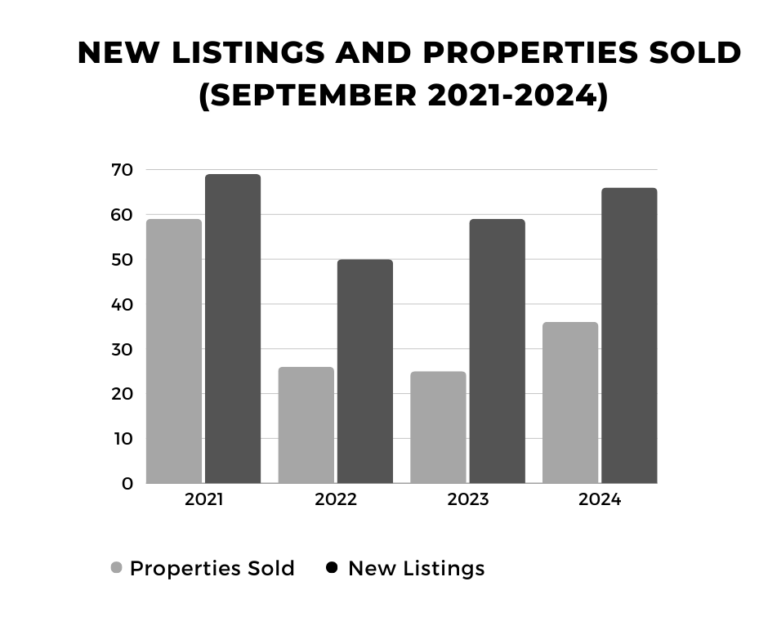
LBI Real Estate Market Report October 2024 Post author: Guarino Team Post published:October 9, 2024 Post category:Real Estate Blog October Market Update September Statistics vs. (September 2021-2023 Avg.) 🏠 New Listings: 66 (59) +11%🗝️ Properties Sold: 36 (46) – 💵 Avg. Sale Price $2.460 ($1.770) +39%💰 Med. Sale Price $2.150 ($1.610) +33%⌛ Med. Days to Sale 47 (23) +24 days🤝 Sale to Original 94% (97.4%) -3.4% vs. (Trailing 12 Month Avg.) 🏠 New Listings: 66 (43) +52%🗝️ Properties Sold: 36 (28) +27%💵 Avg. Sale Price $2.460 ($2.040) +21%💰 Med. Sale Price $2.150 ($1.83) +18%⌛ Med. Days to Sale 47 (43) +4 days🤝 Sale to Original 94% (94.5%) -.5% Current Inventory View all listings Total Listings: 166Single-Family: 129Condos/Townhomes: 25Multi-Family: 12💵 Average List Price $2,710,000💰 Median List Price $2,200,000⌛ Median Days on Market 45 Latest Listings 53 ACTIVE UNDER CONTRACT $1,395,000 2600 Long Beach Boulevard 3, Long Beach Township, NJ 2 Beds3 Baths1,877 SqFt 76 ACTIVE $2,995,000 15 W Harding Avenue , Long Beach Township, NJ 5 Beds4 Baths2,828 SqFt 43 ACTIVE UNDER CONTRACT $1,395,000 2600 Long Beach Boulevard 5, Long Beach Township, NJ 2 Beds3 Baths1,877 SqFt 60 ACTIVE UNDER CONTRACT $899,000 510 N Bay Avenue 303, Beach Haven, NJ 2 Beds2 Baths1,269 SqFt 71 ACTIVE $7,495,000 128 Long Beach , Long Beach Township, NJ 5 Beds4 Baths2,433 SqFt 33 ACTIVE $1,350,000 2600 Long Beach Boulevard 8, Long Beach Township, NJ 2 Beds3 Baths1,877 SqFt 46 ACTIVE $1,350,000 2600 Long Beach Boulevard 7, Long Beach Township, NJ 3 Beds3 Baths1,877 SqFt 31 ACTIVE $1,350,000 2600 Long Beach Boulevard 9, Long Beach Township, NJ 2 Beds3 Baths1,877 SqFt 77 ACTIVE $1,895,000 305 W 18th Street , Ship Bottom, NJ 4 Beds3 Baths2,163 SqFt 84 ACTIVE $2,950,000 30 W Harding Avenue , Long Beach Township, NJ 5 Beds5 Baths3,038 SqFt Browse by Community Barnegat Light $679K - $7.2M 16 listings View Community Beach Haven $479K - $8.9M 34 listings View Community Beach Haven Crest $699K - $6.3M 1 listings View Community Beach Haven Gardens $1.3M - $2.6M 2 listings View Community Beach Haven Park $600K - $2.5M 1 listings View Community Beach Haven Terrace $1.1M - $8.9M 1 listings View Community Latest Blog Posts Local Guide Original Music from LBI: New Releases & Upcoming Live Shows Explore the vibrant LBI music scene with local band manager and writer Monique Demopoulos, as she shines a spotlight on Monique Demopoulos May 15, 2025 Local Guide The Ultimate LBI Coffee Guide: Must-Try Drinks, Work-Friendly Spots & More Discover the best coffee shops on LBI —from must-try signature drinks to cozy, remote-work friendly cafes. Your complete guide to Andie Keefe May 13, 2025 Local Guide Where to Catch Live Music on Long Beach Island Discover all the best spots for live music on Long Beach Island, from beach bars to lively venues. Patrick Johns May 13, 2025 Local Guide LBI Handicap Beach Access Guide: Ramps, Shuttle & Wheelchair Info Learn about handicap beach access on LBI including ramps, beach wheelchairs, gator rides to the beach and accessible entry points. Guarino Team May 8, 2025 Local Guide Ultimate LBI Happy Hour Guide (Summer 2025) Featuring hours, days, food/drink offerings and seating restrictions for all 26 LBI bars. Beau Guarino May 8, 2025 Local Guide LBI Beach Access Guide (Summer 2025) Looking for information on accessing Long Beach Island Beaches this summer? This guide has you covered! Guarino Team May 5, 2025 Read more articles Previous PostBest Year-Round Restaurants on Long Beach IslandNext PostPlanning your LBI Wedding Bar: Expert Advice from Local Owner You Might Also Like LBI Real Estate Market Report July 2024 July 9, 2024 LBI Real Estate Market Report August 2024 August 13, 2024 LBI Real Estate Market Report September 2024 September 10, 2024