September Market Update
August Statistics
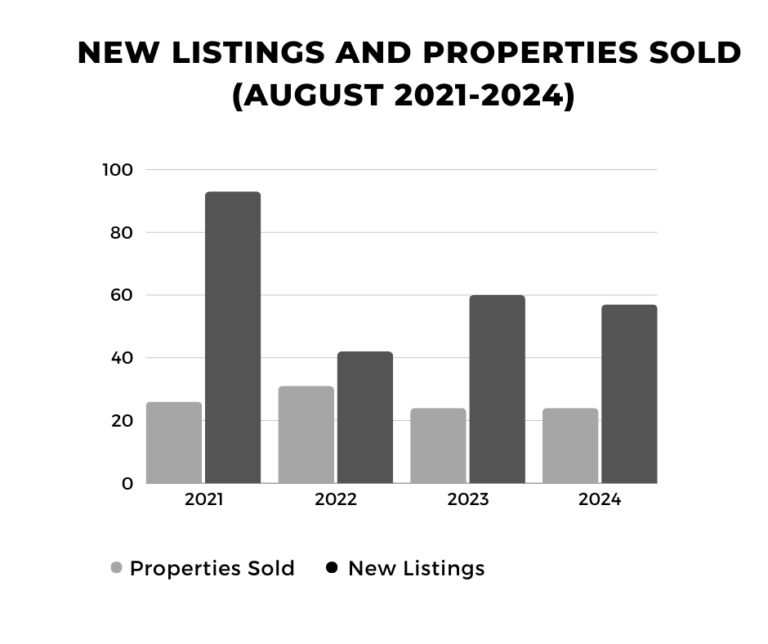
vs. (August 2021-2023 Avg.)
🏠 New Listings: 57 (65) -12%
🗝️ Properties Sold: 24 (27) +36%
💵 Avg. Sale Price $2.175 ($1.9) +14%
💰 Med. Sale Price $2.030 ($1.86) +19%
⌛ Med. Days to Sale 35 (35) –
🤝 Sale to Original 96.1.% (97.9%) -1.8%
vs. (Trailing 12 Month Avg.)
🏠 New Listings: 57 (41) +38%
🗝️ Properties Sold: 24 (28) -15%
💵 Avg. Sale Price $2.175 ($2.010) +8%
💰 Med. Sale Price $2.030 ($1.80) +12%
⌛ Med. Days to Sale 35 (42) -7 days
🤝 Sale to Original 96.1.% (94.2%) +1.8%
Current Inventory
Total Listings: 145
Single-Family: 119
Condos/Townhomes: 18
Multi-Family: 8
💵 Average List Price $2,815,000
💰 Median List Price $2,250,000
⌛ Median Days on Market 54
Recent Listings
Browse by Community
Latest Blog Posts
- Local Guide
Explore the vibrant LBI music scene with local band manager and writer Monique Demopoulos, as she shines a spotlight on
- Monique Demopoulos
- Local Guide
Discover the best coffee shops on LBI —from must-try signature drinks to cozy, remote-work friendly cafes. Your complete guide to
- Andie Keefe
- Local Guide
Discover all the best spots for live music on Long Beach Island, from beach bars to lively venues.
- Patrick Johns
- Local Guide
Learn about handicap beach access on LBI including ramps, beach wheelchairs, gator rides to the beach and accessible entry points.
- Guarino Team
- Local Guide
Featuring hours, days, food/drink offerings and seating restrictions for all 26 LBI bars.
- Beau Guarino
- Local Guide
Looking for information on accessing Long Beach Island Beaches this summer? This guide has you covered!
- Guarino Team
